Quick Facts
- Essential Fat: Men require 2-5% while women require 10-13% for basic physiological function.
- Fitness Benchmarks: For active adults, a fitness-oriented range is typically 14-17% for men and 21-24% for women.
- Age Progression: Healthy body fat levels naturally increase by approximately 3-5% per decade after age 40 due to hormonal shifts and muscle loss.
- Longevity Metric: Tracking body composition is a superior predictor of cardiovascular disease risk than Body Mass Index (BMI).
- Top Measurement: DEXA scans remain the clinical gold standard for distinguishing between visceral adiposity and lean body mass.
- Women's Health: Higher fat percentages in women are critical for maintaining bone density and essential fat requirements for female hormonal balance.
A body fat percentage chart serves as a vital tool for assessing body composition beyond weight alone. It differentiates between lean body mass and actual fat tissue, providing a clearer picture of metabolic health than traditional scales.
Understanding Your Body Fat Percentage
When we discuss fitness and longevity, the number on the scale is often the least interesting data point. To truly understand your health trajectory, you must look at your body composition. This metric tells us how much of your total weight is comprised of adipose tissue (fat) versus lean body mass, which includes muscle, bone, organs, and water.
There are two primary types of fat in the human body: essential fat and storage fat. Essential fat is the minimum amount of adipose tissue required for the body to function. It is necessary for temperature regulation, vitamin absorption, and the production of hormones. This is why women require a significantly higher percentage of fat than men; according to the American Council on Exercise, essential fat requirements are 10% to 13% for women compared to 2% to 5% for men. Falling below these levels can lead to organ failure, loss of bone density, and severe metabolic health issues.
Storage fat, on the other hand, consists of subcutaneous fat (the fat under the skin) and visceral adiposity (the fat stored around internal organs). While some storage fat is healthy and provides energy reserves, excess accumulation—particularly visceral fat—is a major contributor to systemic inflammation and chronic disease. Understanding a healthy body fat percentage for women and men is about finding the balance where your energy stores support your lifestyle without burdening your cardiovascular system.
The Complete Body Fat Percentage Chart by Age and Gender
As we age, our bodies undergo physiological changes. Sarcopenia, or the age-related loss of skeletal muscle mass, naturally shifts our body composition ratios even if our weight remains stable. Consequently, what is considered a healthy body fat percentage in your 20s will look different in your 60s.
The following body fat percentage chart outlines the standard categories used by health professionals to assess fitness levels and health risks across different life stages.
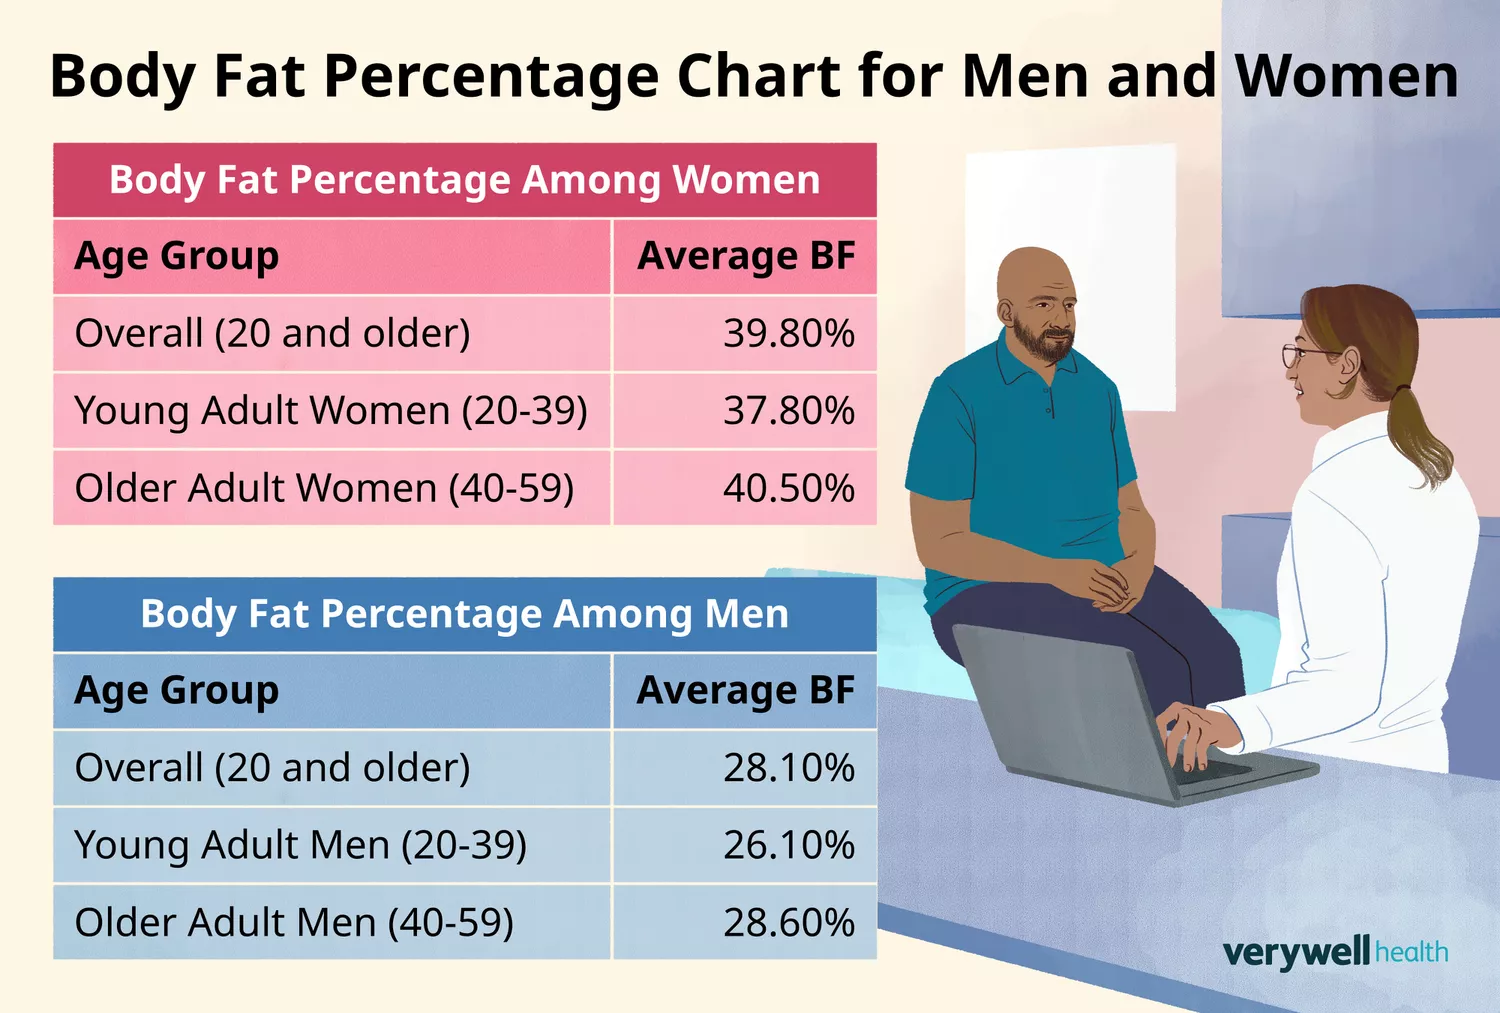
| Age Group | Category | Men's Range (%) | Women's Range (%) |
|---|---|---|---|
| 20 - 39 | Athlete | 6 - 12% | 14 - 20% |
| Fitness | 13 - 17% | 21 - 24% | |
| Acceptable | 18 - 24% | 25 - 31% | |
| Obesity Risk | 25%+ | 32%+ | |
| 40 - 59 | Athlete | 11 - 17% | 19 - 22% |
| Fitness | 18 - 22% | 23 - 29% | |
| Acceptable | 23 - 27% | 30 - 34% | |
| Obesity Risk | 28%+ | 35%+ | |
| 60 - 79 | Athlete | 13 - 19% | 21 - 24% |
| Fitness | 20 - 24% | 25 - 31% | |
| Acceptable | 25 - 29% | 32 - 37% | |
| Obesity Risk | 30%+ | 38%+ |
Research indicates that for adults aged 20 to 39, healthy body fat ranges are 8% to 19% for men and 21% to 33% for women. As you move into later decades, these ranges expand. For example, maintaining healthy body fat levels for women over 50 often requires a slightly higher percentage to support hormonal health after menopause and protect against bone fractures.
Did You Know? Visceral adiposity is metabolically active. Unlike the fat on your hips or arms, visceral fat secretes inflammatory cytokines that directly increase your risk of insulin resistance and type 2 diabetes.
For those pursuing elite performance, observing body fat percentage standards for male athletes can be helpful, but it is important to remember that these levels are often temporary for specific competitions and are not always sustainable for long-term longevity. Most non-athletes should aim for the fitness or acceptable categories to ensure they are meeting ideal body fat ranges by age while maintaining high energy levels.
Body Fat vs. BMI: Why Composition Matters for Longevity
For decades, the medical community relied on Body Mass Index (BMI) to categorize health. However, BMI is a blunt instrument. It is a simple calculation of weight divided by height squared, which fails to account for what that weight actually is. A professional linebacker and a sedentary individual of the same height and weight would have the same BMI, yet their metabolic health and cardiovascular disease risk would be worlds apart.
This discrepancy is why understanding body fat percentage vs bmi for health is so critical. A person can have a normal BMI but still suffer from high visceral adiposity—a condition often called normal weight obesity or being skinny fat. Conversely, a person with significant muscle mass might be classified as overweight by BMI standards while possessing excellent heart health and a low body fat percentage.
By focusing on the muscle-to-fat ratio, we can better predict longevity. Muscle tissue is metabolically expensive; it burns more calories at rest and improves glucose disposal. Maintaining a high ratio of muscle to fat is one of the most effective ways to combat the metabolic slowdown associated with aging. When you learn how to interpret body fat percentage categories for fitness, you stop chasing a lower number on the scale and start chasing a healthier internal environment.
How to Measure Your Body Fat Percentage Accurately
If you want to use a body fat percentage chart effectively, you need an accurate way to measure your current standing. There are several methods available, ranging from household tools to clinical scans.
- Bioelectrical Impedance Analysis (BIA): This is the technology found in most smart scales. It sends a small electrical current through the body and measures resistance. While convenient for tracking trends, BIA is highly sensitive to hydration levels and can often be inaccurate.
- Skinfold Calipers: A technician pinches subcutaneous fat at specific sites on the body. This is a cost-effective method for those who know how to use them, but it does not account for visceral fat.
- DEXA Scan: Dual-energy X-ray absorptiometry is the gold standard for body composition. It provides a highly detailed map of your bone density, lean mass, and fat distribution. It is the only widely available tool that accurately measures visceral adiposity.
- Hydrostatic Weighing: This involves being submerged in a water tank. While very accurate, it is cumbersome and primarily found in research laboratories or high-end athletic facilities.
Regardless of the method you choose, consistency is key. To get the most out of an ideal body fat percentage chart by age and gender, you should measure yourself under the same conditions—ideally first thing in the morning, fasted, and at the same point in your training cycle.
Managing Your Body Composition: Safety and Sustainability
Achieving a lean physique is a common goal, but as an editor focused on longevity, I must emphasize that lower is not always better. Maintaining body fat standards for fitness levels is healthy; however, pushing for the essential fat levels seen in bodybuilders can be dangerous. For women, dropping too low can cause the cessation of the menstrual cycle, leading to permanent bone loss. For men, chronically low fat can crash testosterone levels and cause persistent fatigue.
The most sustainable way to manage body composition as you age is through resistance training. Lifting weights helps combat sarcopenia and keeps your metabolism elevated. Coupled with a diet high in protein and fiber, resistance training allows you to maintain your lean body mass even during weight loss.
Setting realistic goals is paramount. Instead of aiming for a specific aesthetic, aim for a range on the body fat percentage chart that makes you feel energetic, strong, and cognitively sharp. True health is about maintaining vitality for decades, not just for a season.
FAQ
What is a healthy body fat percentage by age?
A healthy range shifts as you get older. For men in their 20s and 30s, 8% to 19% is typical, whereas for men over 60, 20% to 29% is considered healthy. Women follow a similar trend, moving from 21-32% in young adulthood to 24-37% in their senior years to account for physiological and hormonal changes.
What is the ideal body fat percentage for women?
For the average active woman, the ideal range is usually between 21% and 31%. Athletes may drop into the 14% to 20% range, but it is crucial to stay above the essential fat threshold of 10% to 13% to ensure reproductive health and hormonal balance.
What is the ideal body fat percentage for men?
Most healthy men should aim for a range of 14% to 24%. Those looking for a more athletic or lean appearance often target 6% to 13%, but these lower levels require strict nutritional discipline and are not necessary for general health or longevity.
How do I calculate my body fat percentage?
You cannot calculate body fat percentage with a simple mathematical formula using only weight and height. You must use tools like bioelectrical impedance analysis scales, skinfold calipers, or more advanced methods like a DEXA scan to distinguish between fat and muscle mass.
Is BMI the same as body fat percentage?
No, BMI is a ratio of your total weight to your height and does not distinguish between muscle and fat. Body fat percentage measures the actual proportion of adipose tissue in your body, providing a much more accurate reflection of your metabolic health and physical fitness.
At what body fat percentage do abs show?
Visible abdominal definition typically appears when men drop below 10-12% body fat and women drop below 16-19%. However, this varies based on individual fat distribution and the amount of muscle mass present in the core.
Next Steps for Your Fitness Journey
Improving your body composition is a marathon, not a sprint. If your current levels are outside of the ideal ranges, do not panic. Start by incorporating two to three days of resistance training into your weekly routine and prioritizing whole foods over processed ones. Small, consistent shifts in your muscle-to-fat ratio will pay significant dividends for your long-term wellness. Consult with a qualified fitness professional or a registered dietitian to create a personalized plan that respects your unique biology and age-related needs.